Grafana and Prometheus Kubernetes installation
In this section, I’ll show you how to install Prometheus and Grafana in the k8s cluster using Helm (k8s package manager).
[Prometheus - ] An open-source monitoring system with a dimensional data model, flexible query language, efficient time-series database, and modern alerting approach.
Grafana allows you to query, visualize, alert on and understand your metrics no matter where they are stored.
Let’s start!
For the local k8s cluster, I’ll use Minikube.
The first step is a minikube and helm installation.
choco install minikube
choco install kubernetes-helm
Then, start the minikube.
minikube startThe next step is a k8s dashboard installation:
kubectl apply -f https://raw.githubusercontent.com/kubernetes/dashboard/v2.0.0/aio/deploy/recommended.yamlAfter that, create a user and get a token: link.
For the k8s dashboard access we need to create a proxy.
kubectl proxy --address="127.0.0.1" -p 8001 --accept-hosts='^*$'For Linux, you can run the proxy process in the foreground using & at the end of the command and switch back to process via fg command.
While proxy running, the dashboard is available by this link.
When k8s is ready to use, we need to install Prometheus and Grafana. One of the easiest ways is using helm.
helm repo add prometheus-community https://prometheus-community.github.io/helm-charts
helm repo add grafana https://grafana.github.io/helm-charts

helm repo update

helm install prometheus prometheus-community/prometheus
helm install grafana grafana/grafana
Follow installation notes for getting the admin password and forwarding the port.
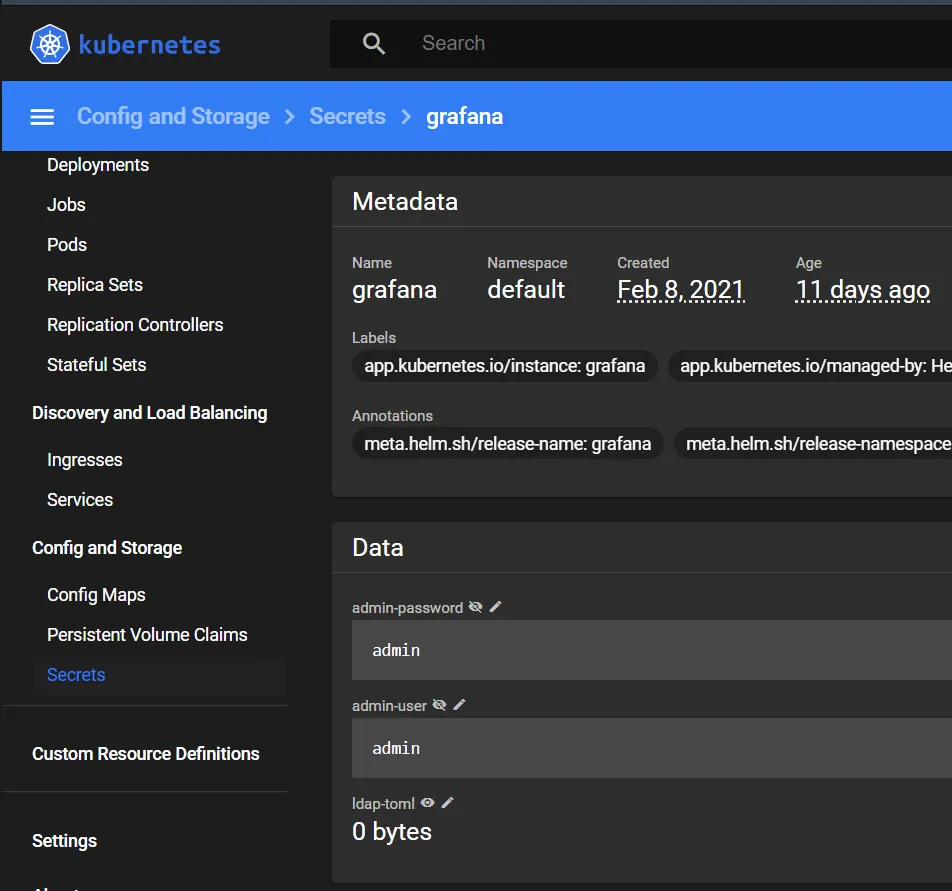
You can see/edit the Grafana admin account via the k8s dashboard. Open tab secret, choose grafana, and at the bottom, you’ll see necessary fields.
Then, you should expose grafana service or run port-forwarding.
kubectl port-forward service/grafana 8080:80After this, you need to define datasource:
click Add Data Source button, choose Prometheus, define http://prometheus-server:80 as URL, and click Save & Test.
Then you can import any k8s dashboard. With id = 12117, for example.
You can add your application in Prometheus/Grafana.
Let’s connect the application from the previous topic to the Prometheus.
We need to add the host into the prometheus.yml configuration file. In our case, this file stores in ConfigMap. Open dashboard, choose Config Maps tab, find prometheus-server and detect target config.
scrape_configs:
- job_name: prometheus
  static_configs:
  - targets:
    - localhost:9090
The default Prometheus metric endpoint is ‘/metrics’. Our application has Prometheus metrics on this endpoint, so we need to add the host and the port (postgis-example.default.svc.cluster.local:8080) as another target.
scrape_configs:
- job_name: prometheus
  static_configs:
    - targets:
        - localhost:9090
        - postgis-example.default.svc.cluster.local:8080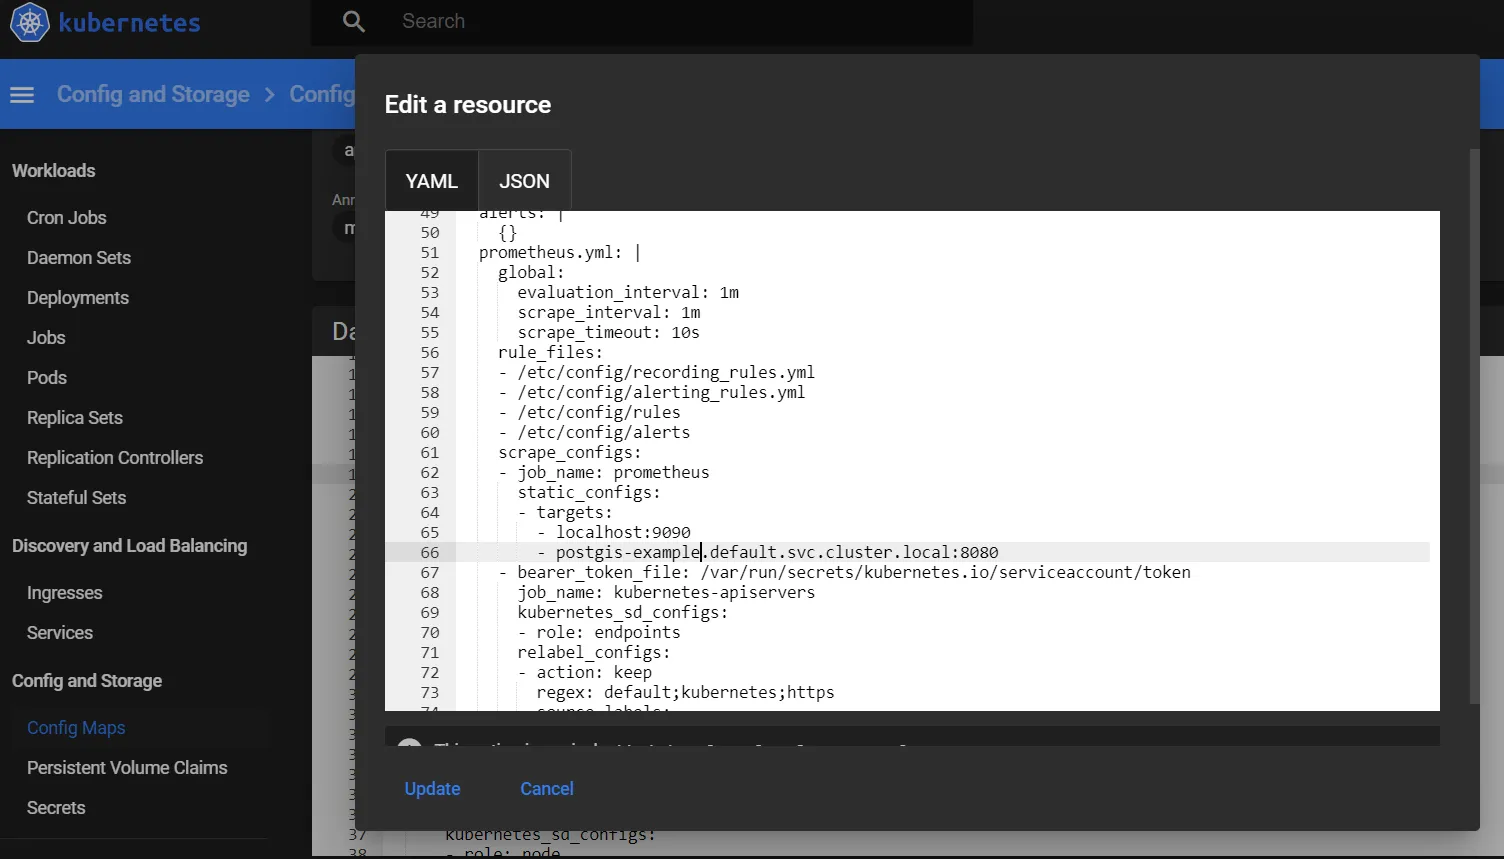
Then, forward the port for prometheus-server and send a POST request to the http://127.0.0.1:9090/-/reload.
kubectl port-forward service/prometheus-server 9090:80
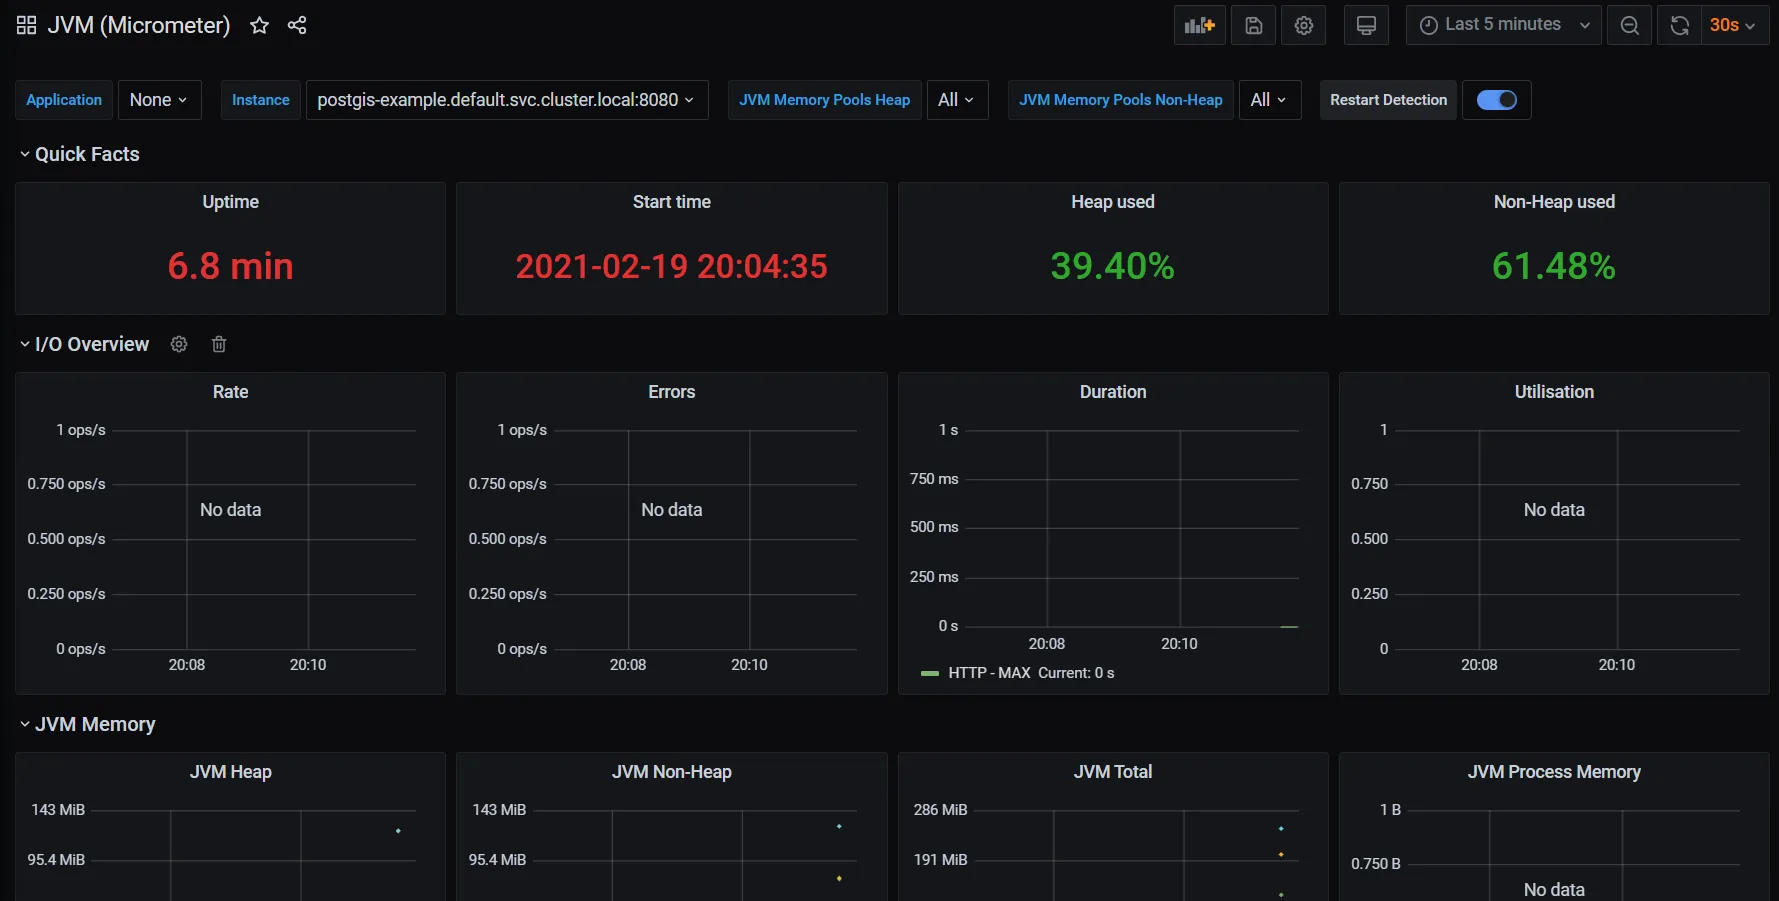
curl -X POST http://127.0.0.1:9090/-/reloadNext, you can add a JVM-specific dashboard. Import via Grafana.com -> 4701 -> Load -> select prometheus datasource -> Import.
You must see a dashboard like this.
All this stuff can be used in the following article.