Migration Java application to Kubernetes. JVM optimisation
This is the third part of the k8s migration articles. There are some things about JVM performance monitoring and optimization here. In the k8s, Java applications usually run without any JVM configurations or with just like this one:
java -jar -Xms=req -Xmx=lim Application.jarIn this case, JVM 10: uses a Serial GC if a machine has less than two available CPUs and two GB of RAM; sets a large amount of memory reservation for the code cache; uses a bigger thread stack size than necessary, etc.
JVM memory consumption can be calculated using this formula:
JVM memory = Heap memory + Metaspace + CodeCache + (ThreadStackSize * Number of Threads) + DirectByteBuffers + Jvm-native
Let’s see how we can change the default settings of JVM.
We can start our application with additional JVM params:
-Djava.security.egd=file:/dev/./urandom see.
-Xms parameter sets the initial heap size.
-Xmx sets the maximum heap size.
-Xss defines thread stack size.
-XX:ReservedCodeCacheSize sets maximum code cache size. Used for JIT compiler.
-XX:CodeCacheMinimumFreeSpace parameter sets minimum code cache size. When less than the specified amount of space remains, stop compiling. This space is reserved for code that is not compiled methods, for example, native adapters.
-XX:CodeCacheExpansionSize sets code cache expansion size.
-XX:+UseG1GC (-XX:+UseParallelGC , -XX:+UseConcMarkSweepGC, -XX:+UseZGC , -XX:+UseShenandoahGC) enables G1 (Parallel, CMS, Z, Shenandoah) GC instead of the default.
-XX:MaxGCPauseMillis sets the target for the maximum GC pause time. JVM can exceed this target.
-XX:ParallelGCThreads sets the number of threads used for stop-the-world phases.
-XX:ConcGCThreads sets the number of threads used for concurrent phases.
-XX:InitiatingHeapOccupancyPercent sets the percentage of the heap occupancy to start a concurrent GC cycle.
-XX:MetaspaceSize when the space committed for class metadata reaches this value, a Full GC starts.
-XX:MaxMetaspaceSize defines maximum metaspace size.
-XX:MinMetaspaceExpansion the minimum growth size for a Metaspace.
-XX:MaxMetaspaceExpansion the maximum growth size for a Metaspace.
-XX:+PerfDisableSharedMem disable writing hsperfdata in persistence storage.
-XX:MaxDirectMemorySize the limit on the amount of memory reservation for all Direct Byte Buffers.
-XX:+AlwaysActAsServerClassMachine the parameter that disables Serial GC usage in cases of the small heap size.
Pay attention that some of these arguments are deprecated/removed in Java 9+!
Let’s run our application with the default JVM settings and load it with the simple workload. We can create a Postman collection or manually send requests to the application. However, jMeter is a wide-spreading solution for the load testing.
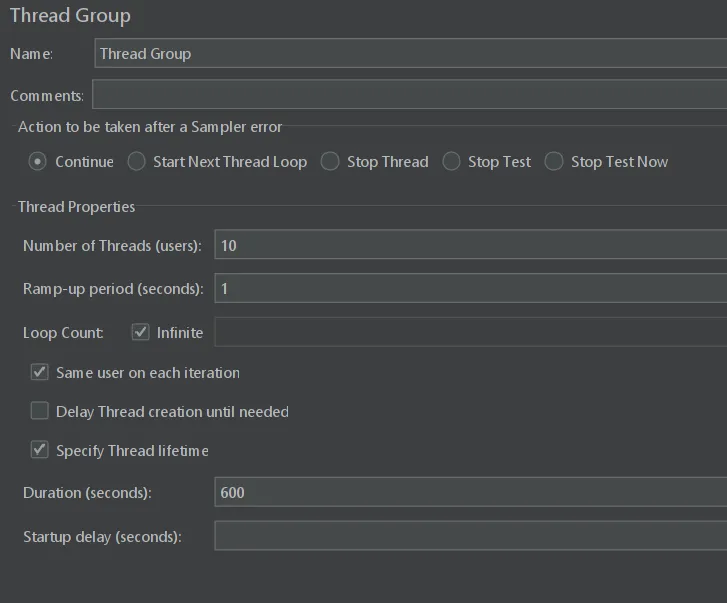
Run jMeter and create tread group in our workload:

Set 10 parallel threads with the infinity loop of workload and 10 minutes timeout.
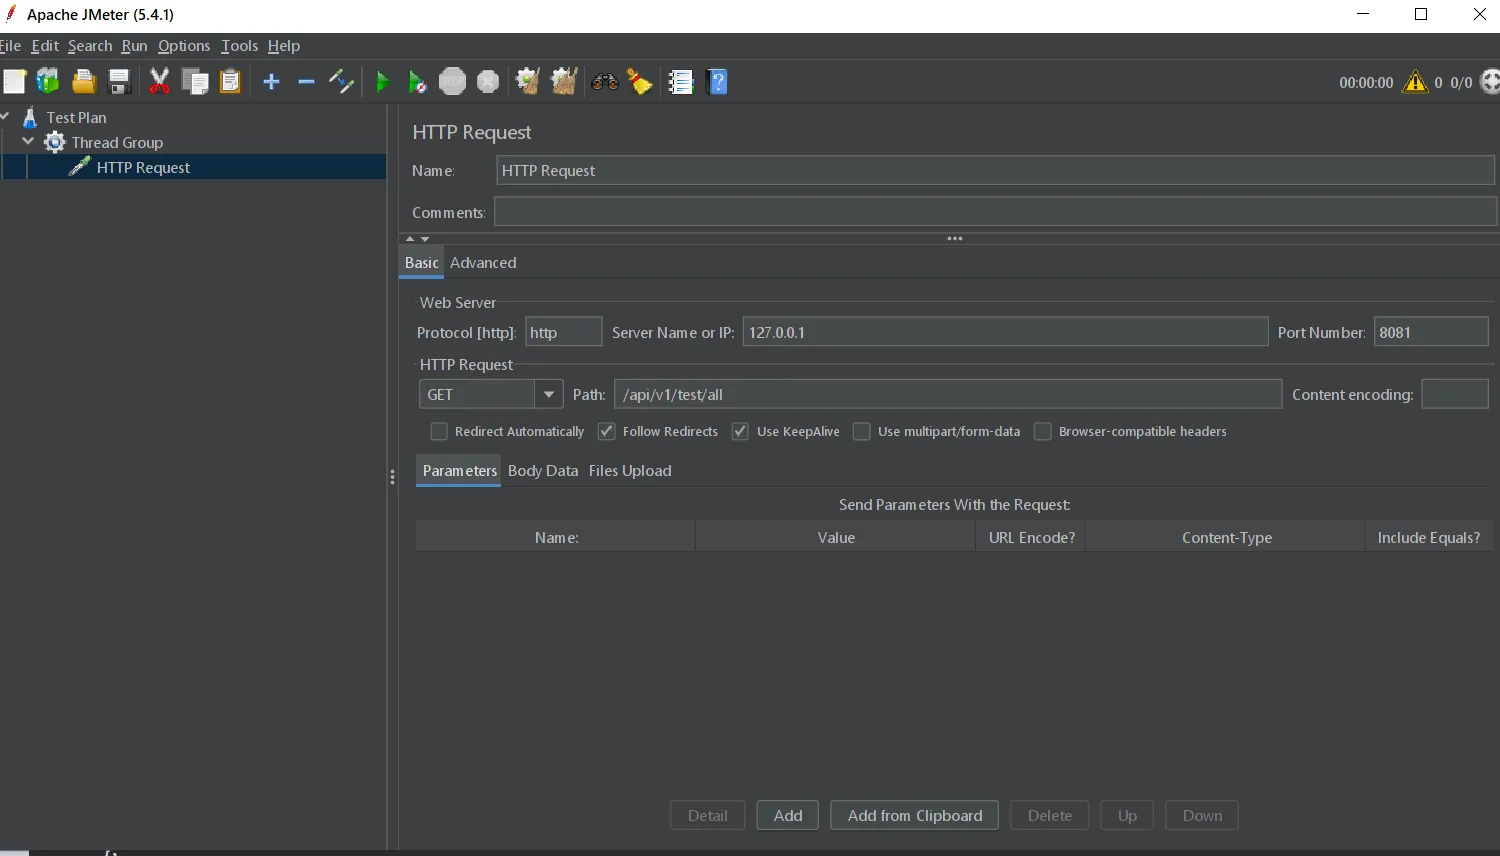
Then, create a new HTTP request.
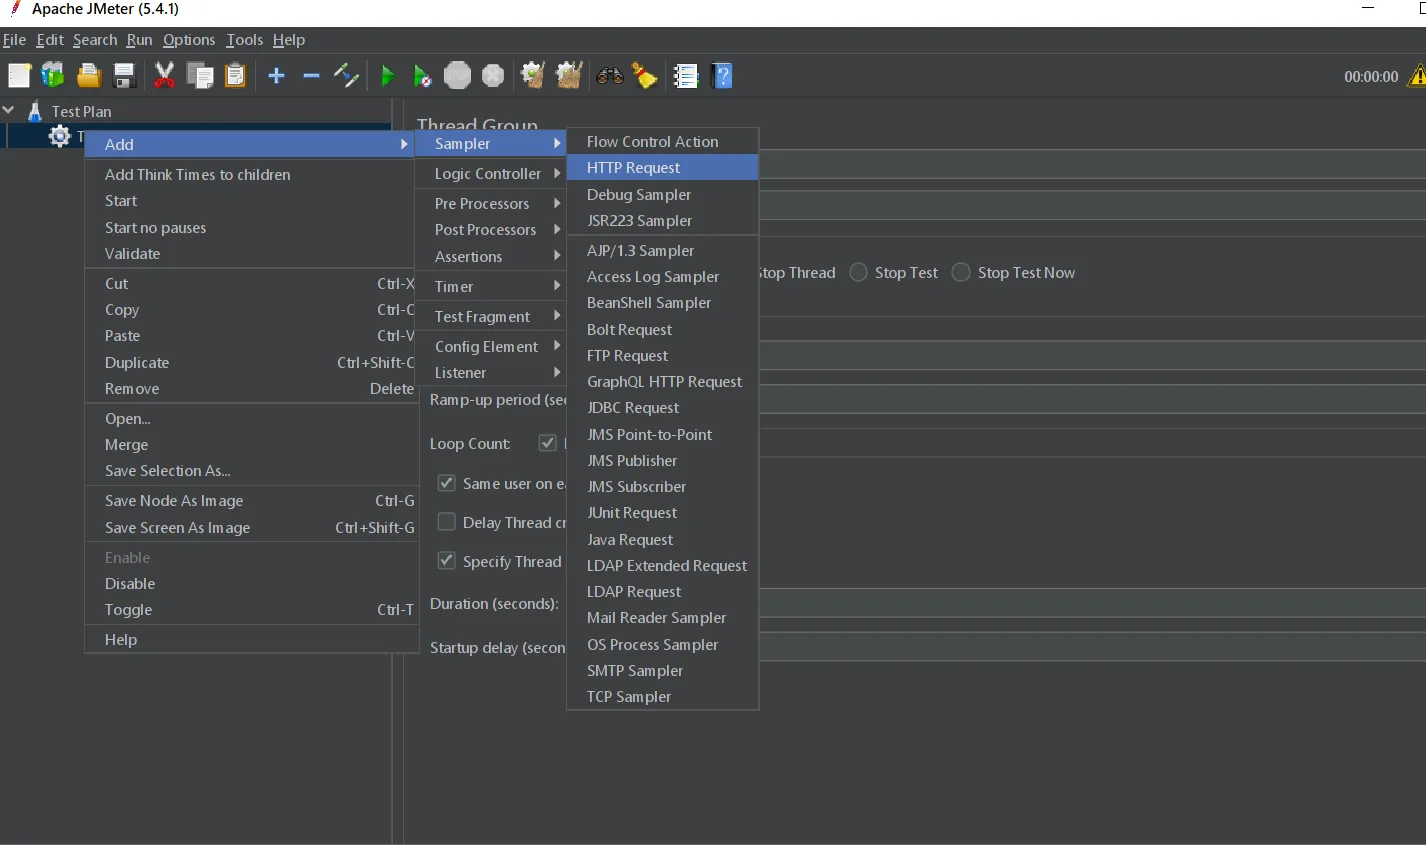
Provide the protocol, the host, the port, the path, and choose the type of the request.
For the result visualisation of our workload, create Graph Results.
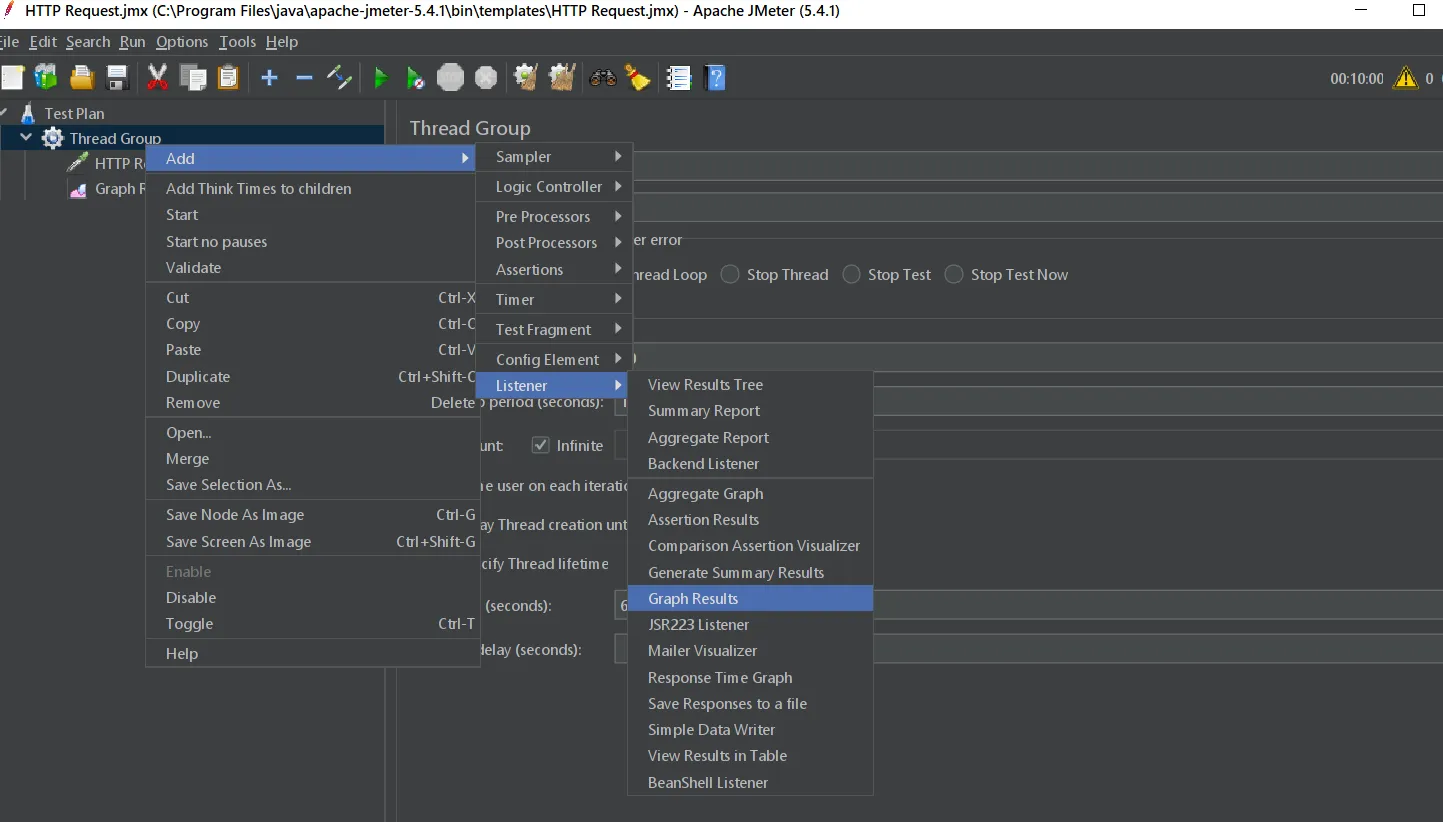
Then, run the test plan. Check results and Grafana metrics for JVM and k8s.
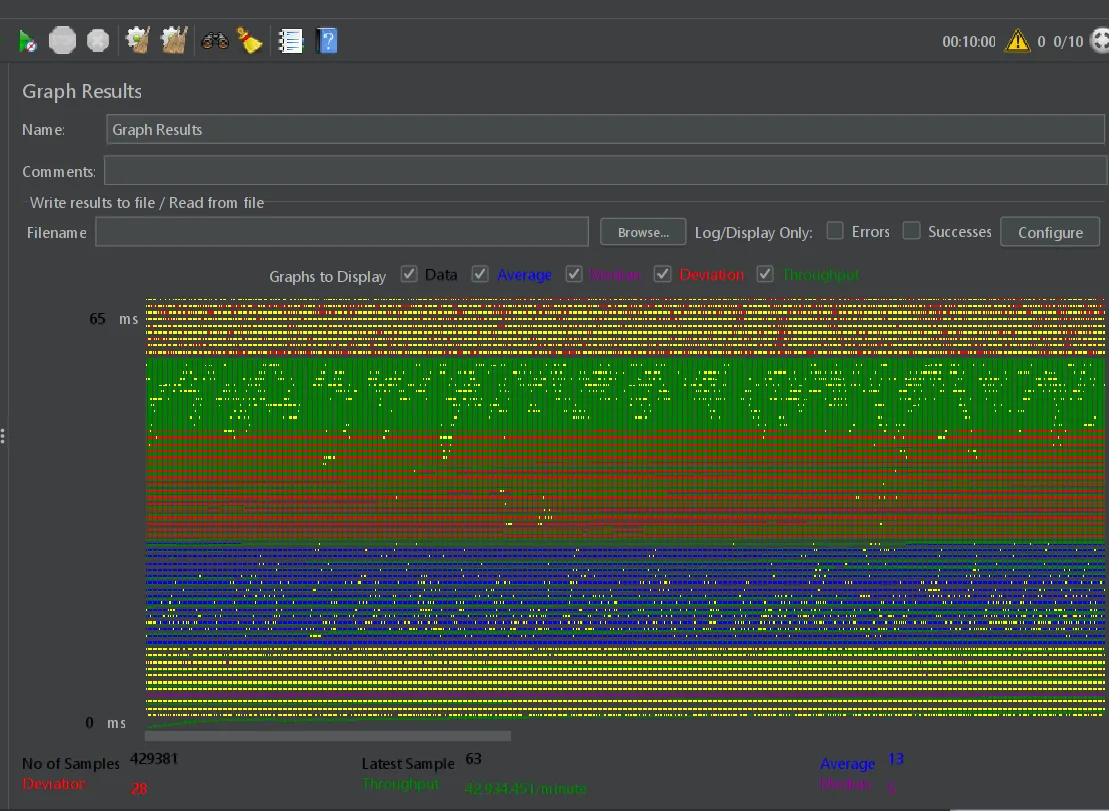
The main thing here is the throughput = 42.9/minute.
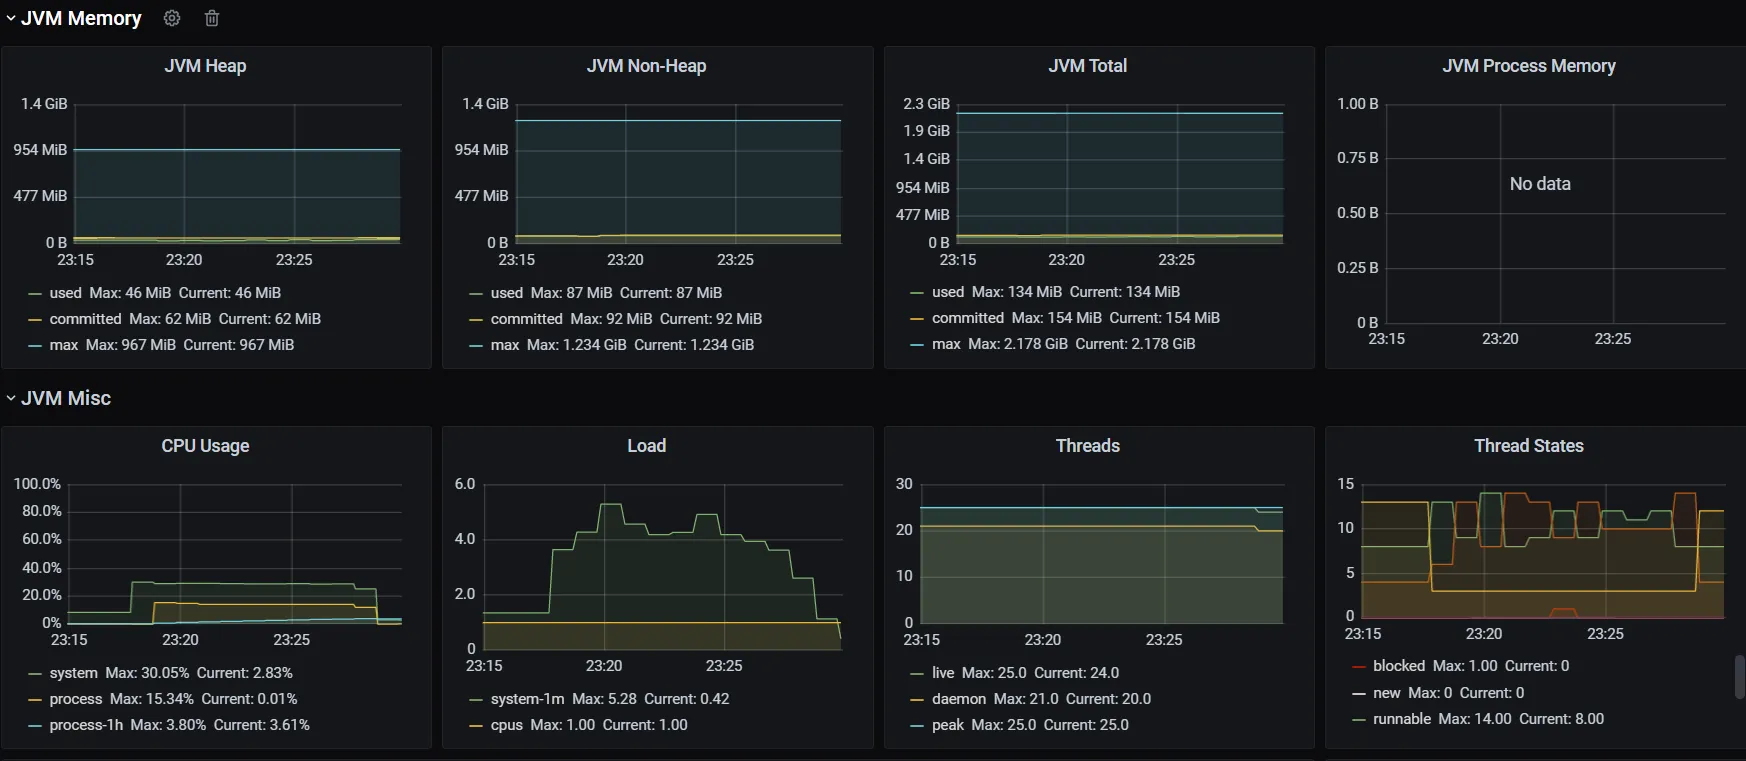
We can see that the application reserves 15 times more heap than consume.
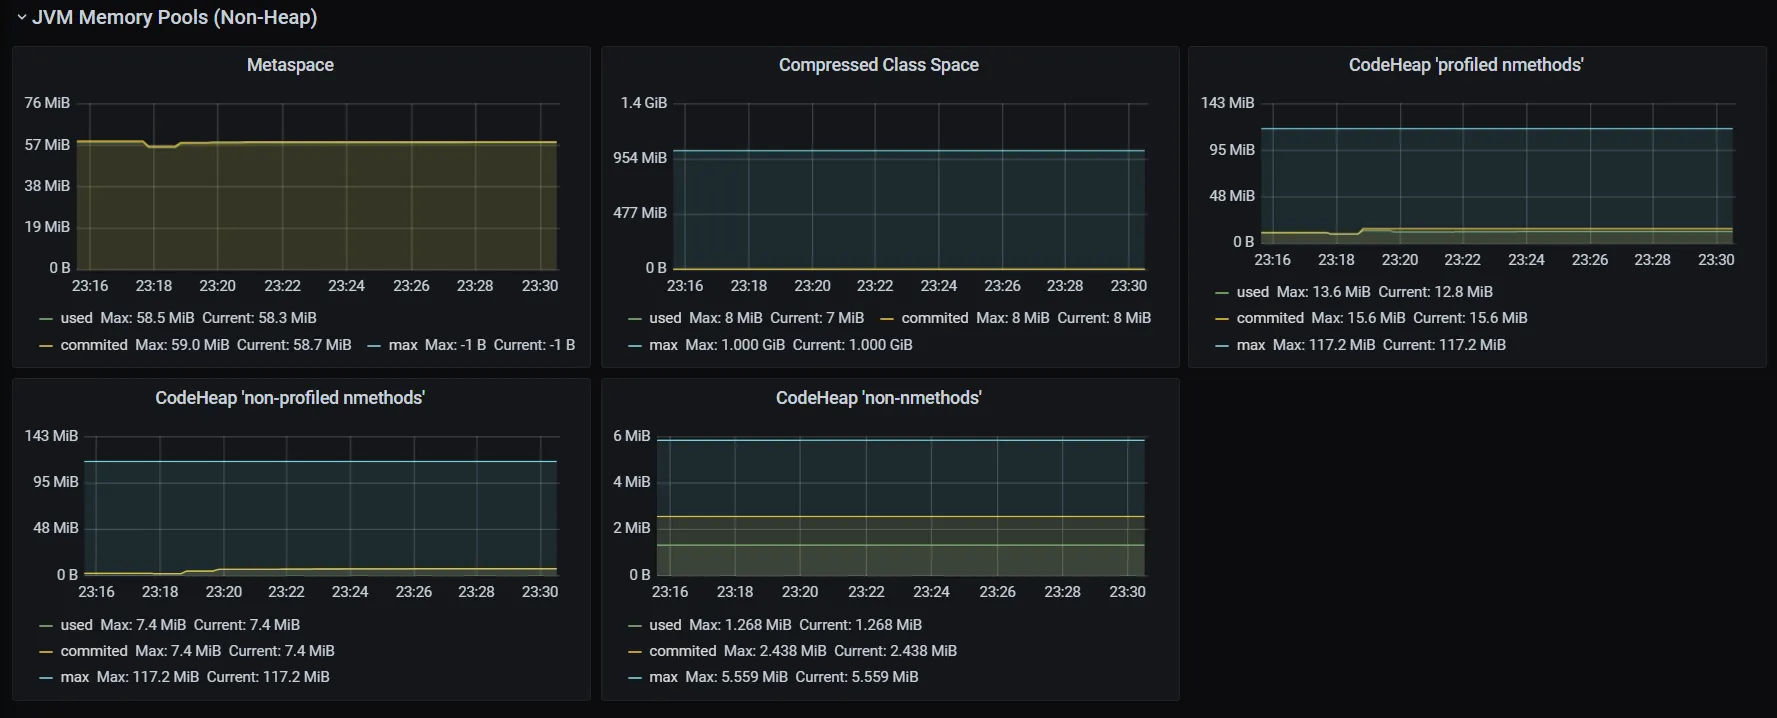
You can reduce Compressed Class Space down to 32m and slightly increase Metaspace.
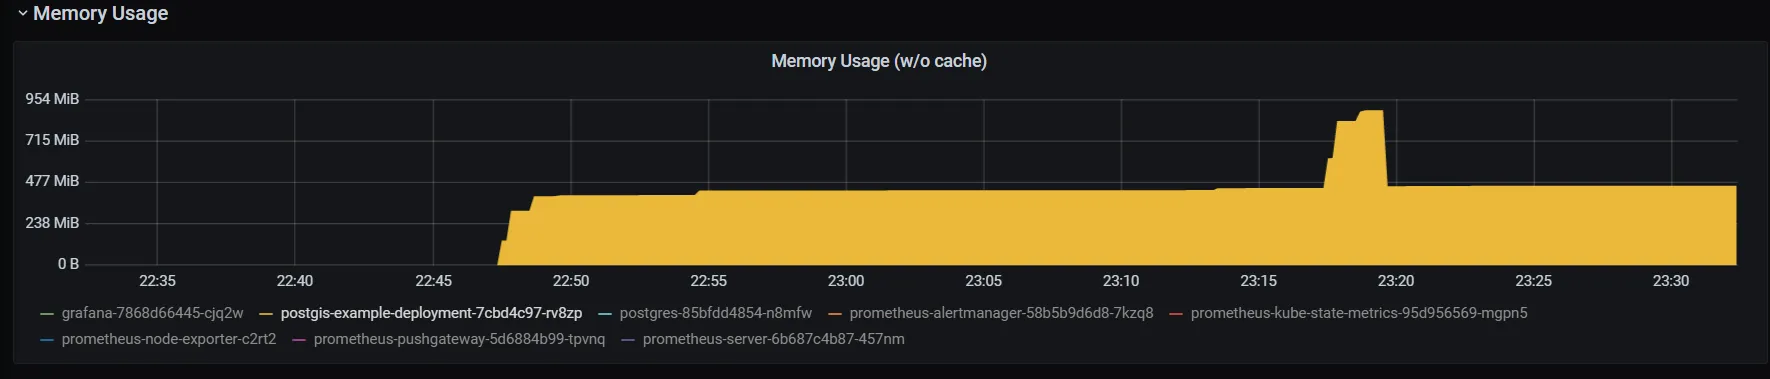
K8s container consumes around 500m, but while the workload increase, it consumes almost 900m!
We can try to reduce general parameters, apply new settings, and rerun the test plan.
-Xms128M
-Xmx128M
-Xss1024k
-XX:ReservedCodeCacheSize=32M
-XX:CodeCacheExpansionSize=512k
-XX:MaxDirectMemorySize=64M
-XX:CompressedClassSpaceSize=32M
-XX:MaxMetaspaceSize=64M
-XX:+PerfDisableSharedMem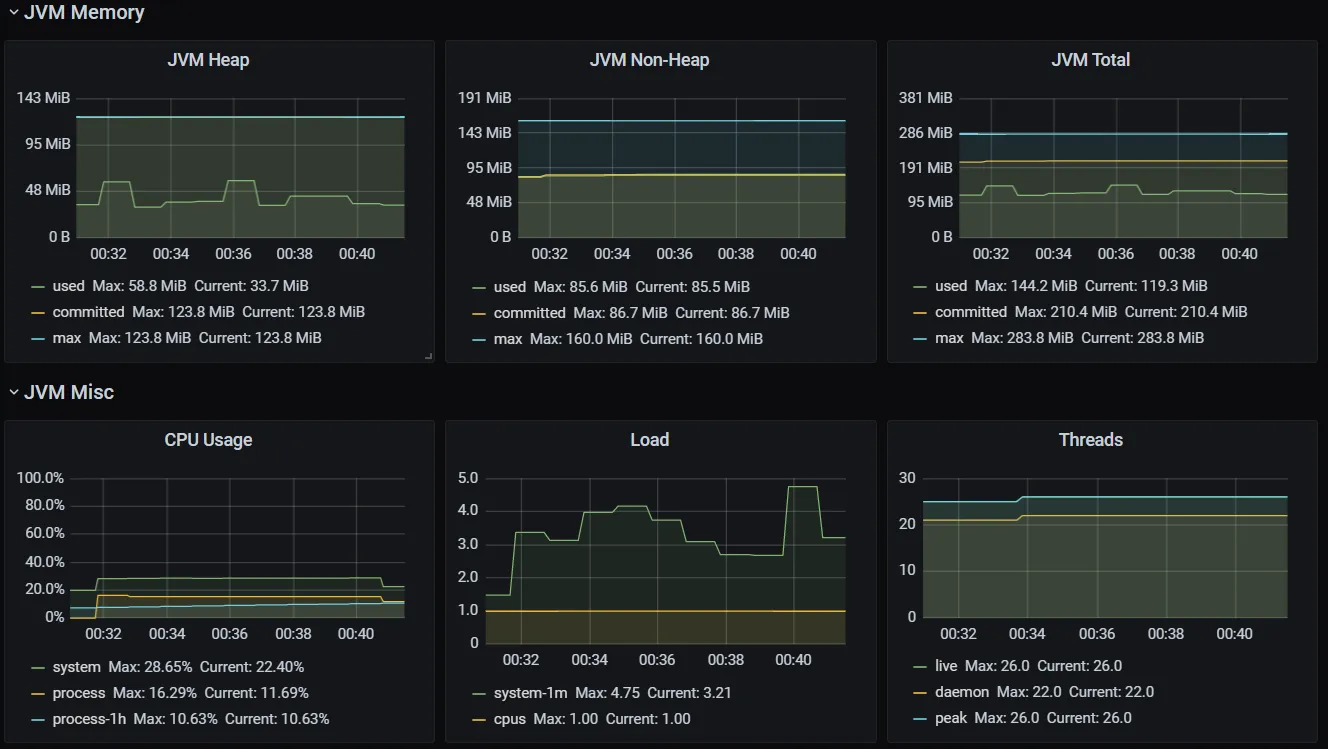
With the strictly defined heap size, JVM starts to use all available space.
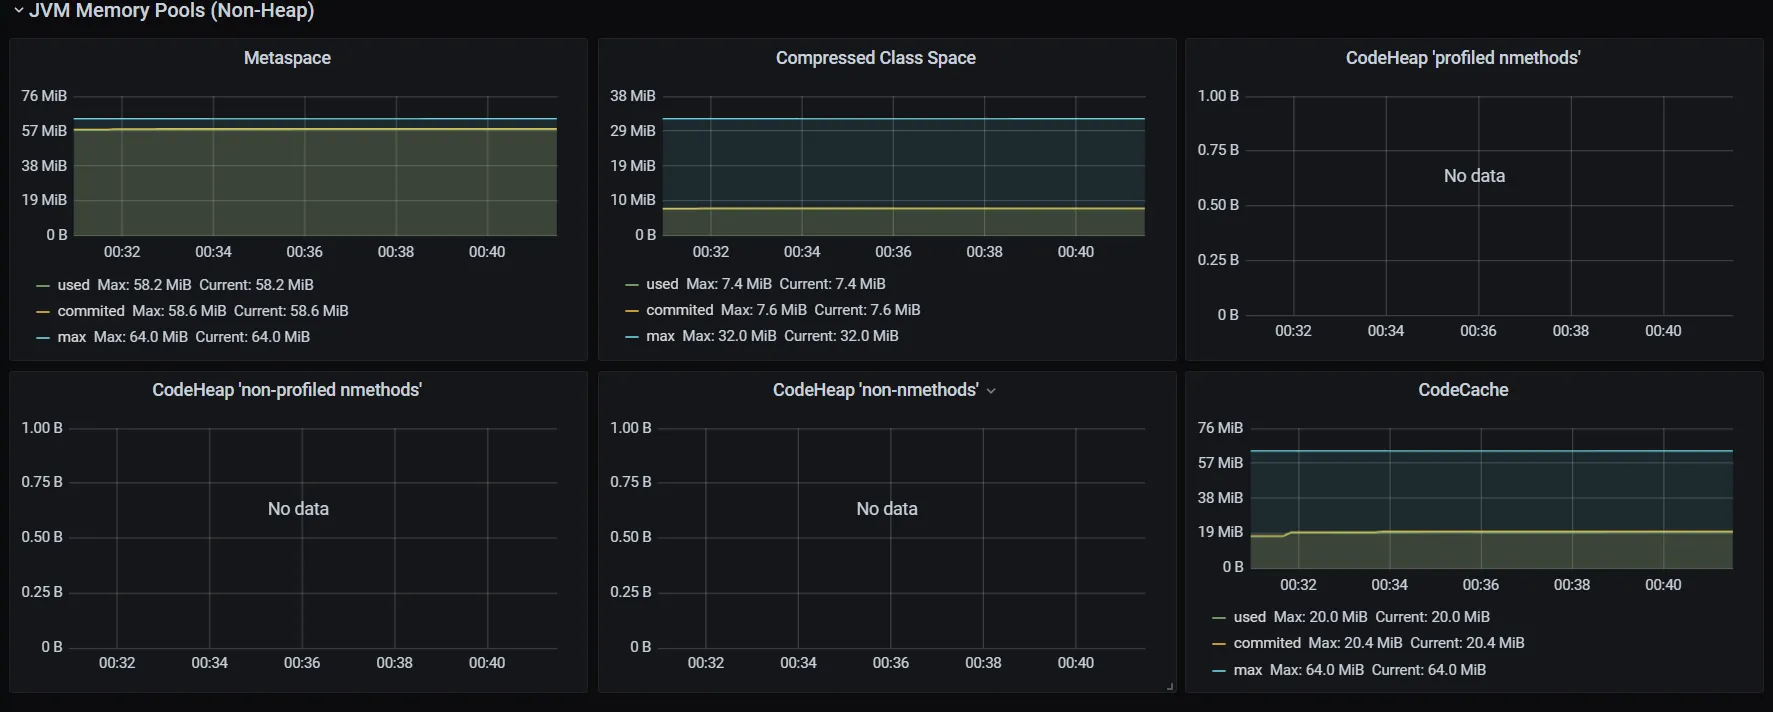
In Non-Heap, we can reduce Compressed Class Space down to 16m and Code Cache down to 32m.
There is no peak memory consumption.
Throughput increases up to 43.6/minute with this memory limit reduction.

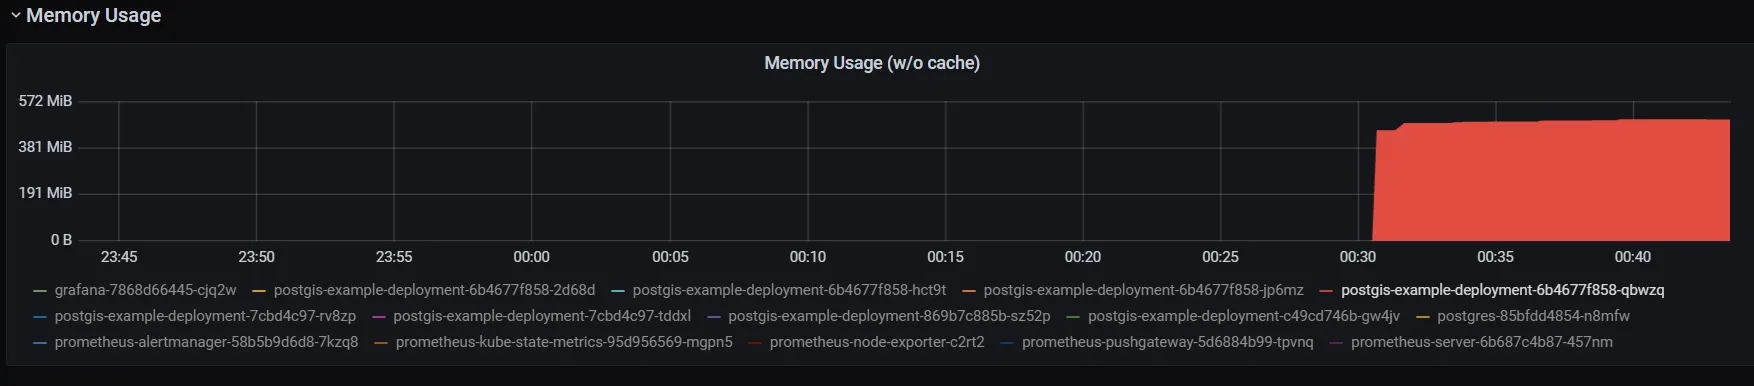
Unfortunately, when you try to track resource usage in Grafana or analogs, you’ll see that JVM consumes more RAM than you set via JVM params.
Container memory consumption is 473m.

But JVM heap + non-heap size is 284m.

This can be the reason of exceeding the container memory limits, and, as a consequence, cause the OOM.
For diving deeper into JVM memory usage, we can use Native Memory Tracking(NMT). One of the best topics about NMT.
In few words, we should run our application with these params:
-XX:+UnlockDiagnosticVMOptions
-XX:NativeMemoryTracking=summary
-XX:+PrintNMTStatistics
PrintNMTStatistics flag means that NMT statistics will be printed in stdout by SIGTERM signal. Other way, you can connect in your pod console and run:
pidof javaGet the PID of the process and run this program.
jcmd <pid> VM.native_memory summaryThe result looks like this.
Native Memory Tracking:

Total: reserved=355478KB, committed=238634KB
-                 Java Heap (reserved=131072KB, committed=131072KB)
                            (mmap: reserved=131072KB, committed=131072KB)

-                     Class (reserved=33867KB, committed=8779KB)
                            (classes #12874)
                            (  instance classes #11892, array classes #982)
                            (malloc=1099KB #25615)
                            (mmap: reserved=32768KB, committed=7680KB)
                            (  Metadata:   )
                            (    reserved=57344KB, committed=49408KB)
                            (    used=49168KB)
                            (    free=240KB)
                            (    waste=0KB =0.00%)
                            (  Class space:)
                            (    reserved=32768KB, committed=7680KB)
                            (    used=7452KB)
                            (    free=228KB)
                            (    waste=0KB =0.00%)

-                    Thread (reserved=32977KB, committed=3121KB)
                            (thread #33)
                            (stack: reserved=32888KB, committed=3032KB)
                            (malloc=54KB #194)
                            (arena=36KB #62)

-                      Code (reserved=66988KB, committed=13260KB)
                            (malloc=940KB #5656)
                            (mmap: reserved=66048KB, committed=12320KB)

-                        GC (reserved=809KB, committed=809KB)
                            (malloc=377KB #673)
                            (mmap: reserved=432KB, committed=432KB)

-                  Compiler (reserved=248KB, committed=248KB)
                            (malloc=83KB #591)
                            (arena=165KB #5)

-                  Internal (reserved=172KB, committed=172KB)
                            (malloc=168KB #876)
                            (mmap: reserved=4KB, committed=4KB)

-                     Other (reserved=120KB, committed=120KB)
                            (malloc=120KB #23)

-                    Symbol (reserved=12988KB, committed=12988KB)
                            (malloc=12244KB #329779)
                            (arena=744KB #1)

-    Native Memory Tracking (reserved=5747KB, committed=5747KB)
                            (malloc=8KB #98)
                            (tracking overhead=5739KB)

-        Shared class space (reserved=12288KB, committed=12052KB)
                            (mmap: reserved=12288KB, committed=12052KB)

-               Arena Chunk (reserved=175KB, committed=175KB)
                            (malloc=175KB)

-                   Logging (reserved=5KB, committed=5KB)
                            (malloc=5KB #211)

-                 Arguments (reserved=1KB, committed=1KB)
                            (malloc=1KB #53)

-                    Module (reserved=326KB, committed=326KB)
                            (malloc=326KB #2511)

-                 Safepoint (reserved=8KB, committed=8KB)
                            (mmap: reserved=8KB, committed=8KB)

-           Synchronization (reserved=94KB, committed=94KB)
                            (malloc=94KB #787)

-                 Metaspace (reserved=216KB, committed=216KB)
                            (malloc=216KB #115)

-                   Unknown (reserved=57376KB, committed=49440KB)
                            (mmap: reserved=57376KB, committed=49440KB)
Java Heap reserved and committed size decreases by -Xms and -Xmx. Class size depends on Metaspace. Thread size decreases by stack size -Xss. GC size can be changed by CG changing itself.
Use NMT and JVM params for reducing memory consumption and increasing application performance. Set k8s request and limits based on the NMT results, and do not forget to remove NMT for the production.